Web development today isn’t just for desktops—mobile matters just as much. Real-world launches surface plenty of issues, so reliable debugging techniques are essential.
How do you debug mobile frontends? After digging through documentation and trial-and-error in projects, here’s the workflow I rely on.
Responsive testing
Sites with modest UI components—personal blogs, corporate marketing pages—should already be responsive.
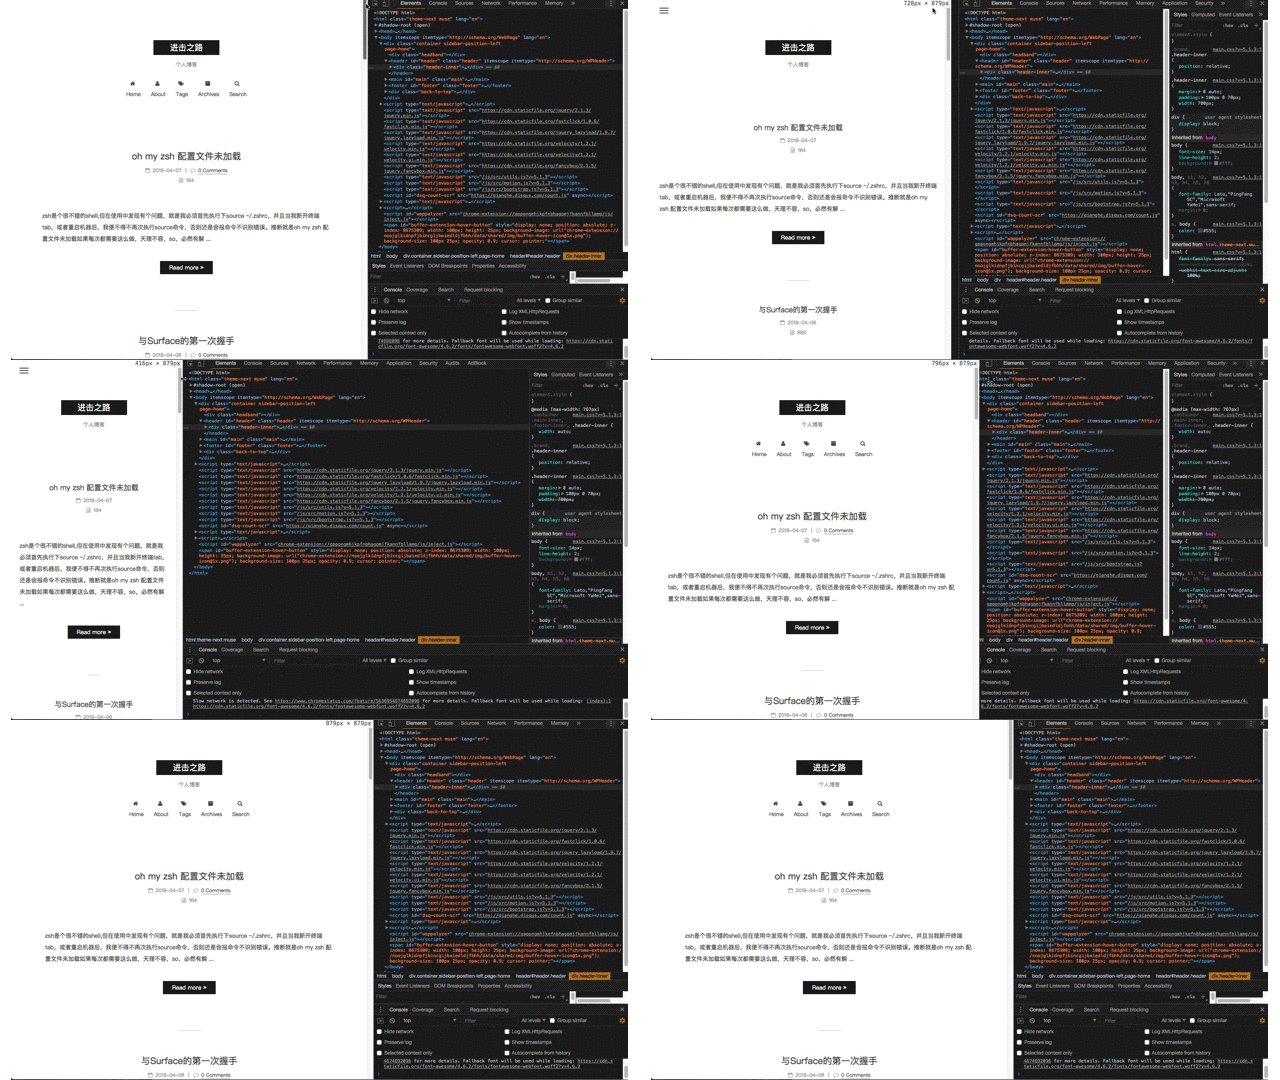
Drag to resize
Testing responsiveness is simple: open Chrome DevTools and drag to resize the viewport.
Device emulation
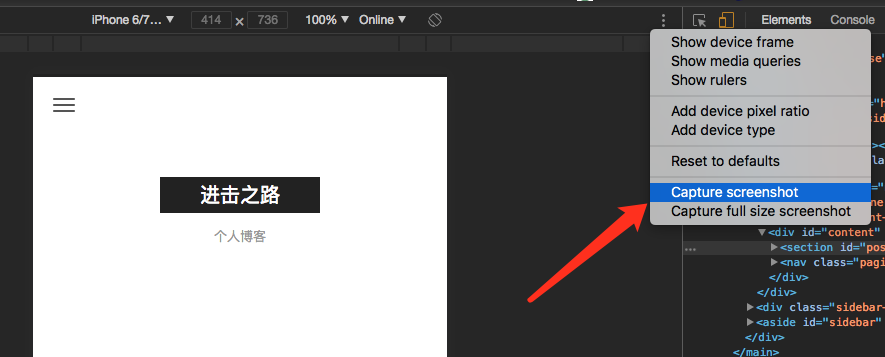
Need to test a specific screen size without the device? Chrome’s device emulation lets you select popular phones or define custom dimensions and device pixel ratios.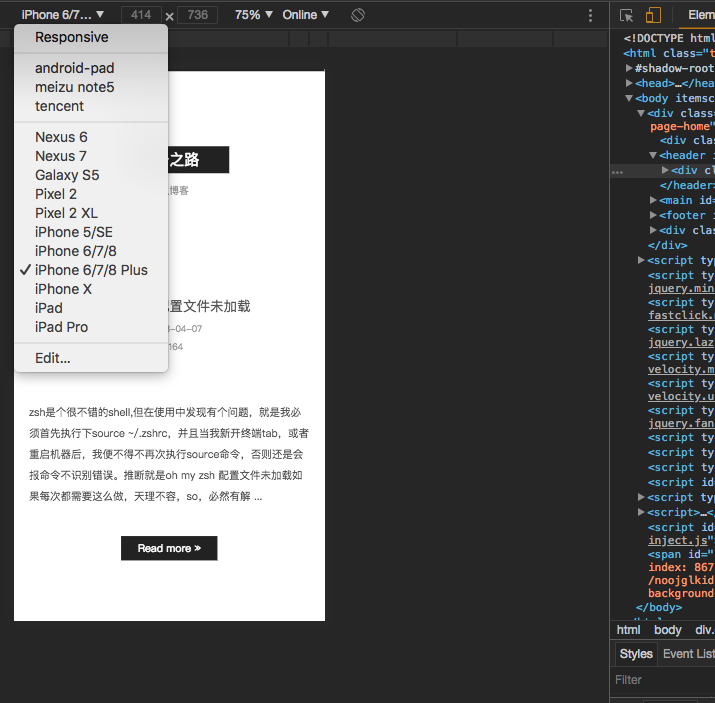
It also supports screenshots and other utilities—a genuine power tool.
Android debugging
Android Emulator
The Android Studio emulator is sufficient for most scenarios.
Android on device
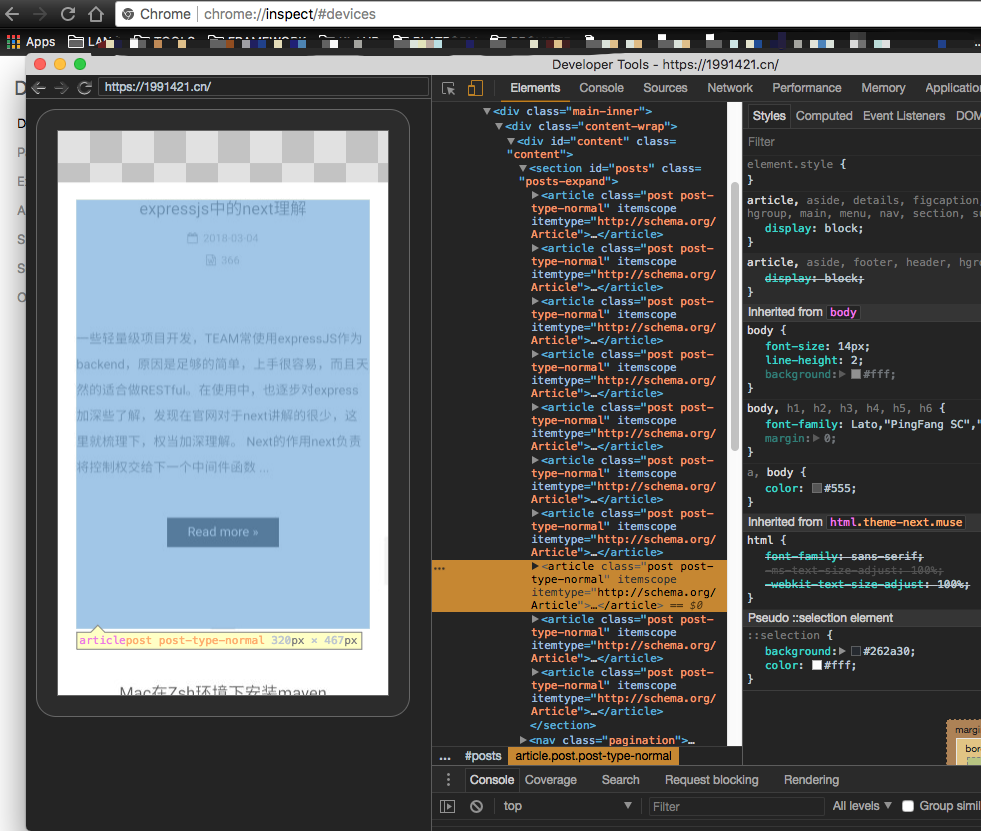
- Connect the phone with a USB cable and enable
USB debuggingunder Developer Options. - In desktop Chrome, open
chrome://inspectto locate the device.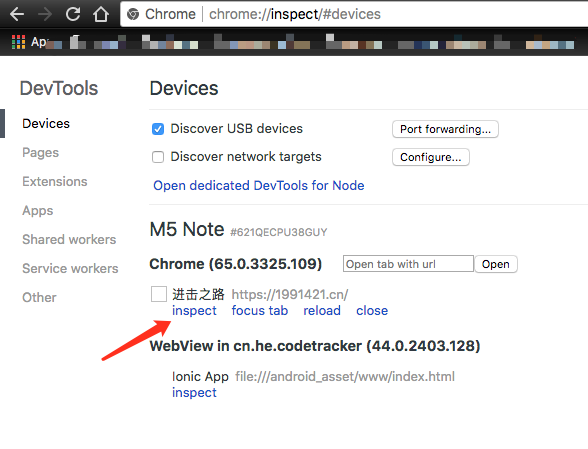
- Click inspect to launch DevTools for the target page.
Notes
- The browser on the device must be
Chrome. - The initial load may require a VPN/proxy if DevTools tries to fetch remote resources.
- The same setup works for WebView-based apps (e.g., Ionic) because they ultimately render web content.
iOS debugging
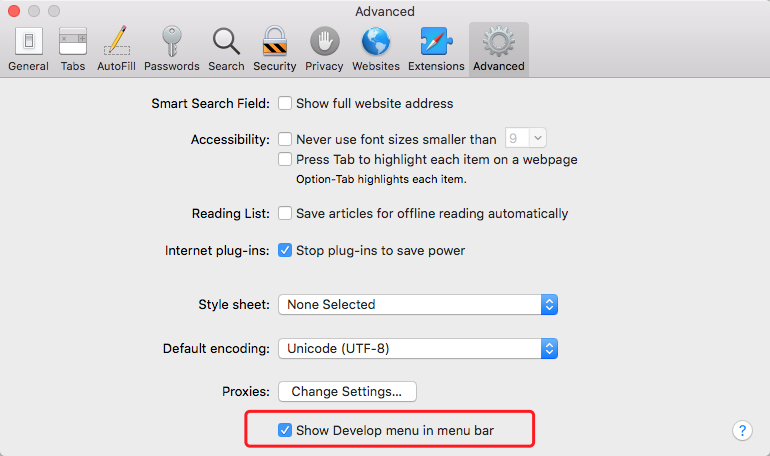
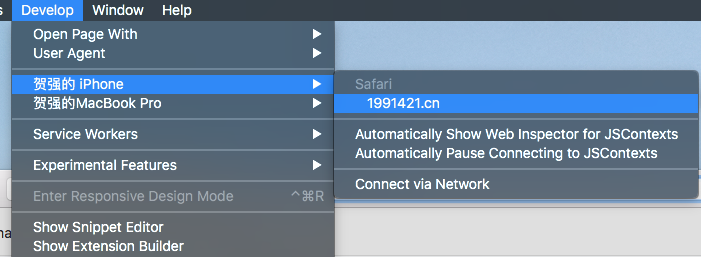
Apple hardware works seamlessly together, and testing follows the same pattern. To debug mobile Safari, first enable the Develop menu in desktop Safari preferences—it’s hidden by default.
iOS Simulator
Pick a device and OS version in the simulator, run the app, then in desktop Safari go to Develop → iPhone Simulator. Select the page to open the Safari DevTools panel.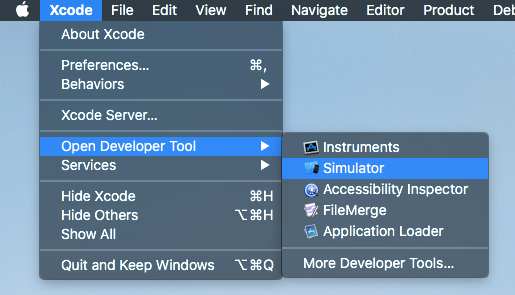

iOS on device
Simulators are great, but real devices provide the most accurate experience. Debugging hardware mirrors the simulator workflow.
Connect the phone via cable and enable the Web Inspector in Safari: Settings → Safari → Advanced → Web Inspector.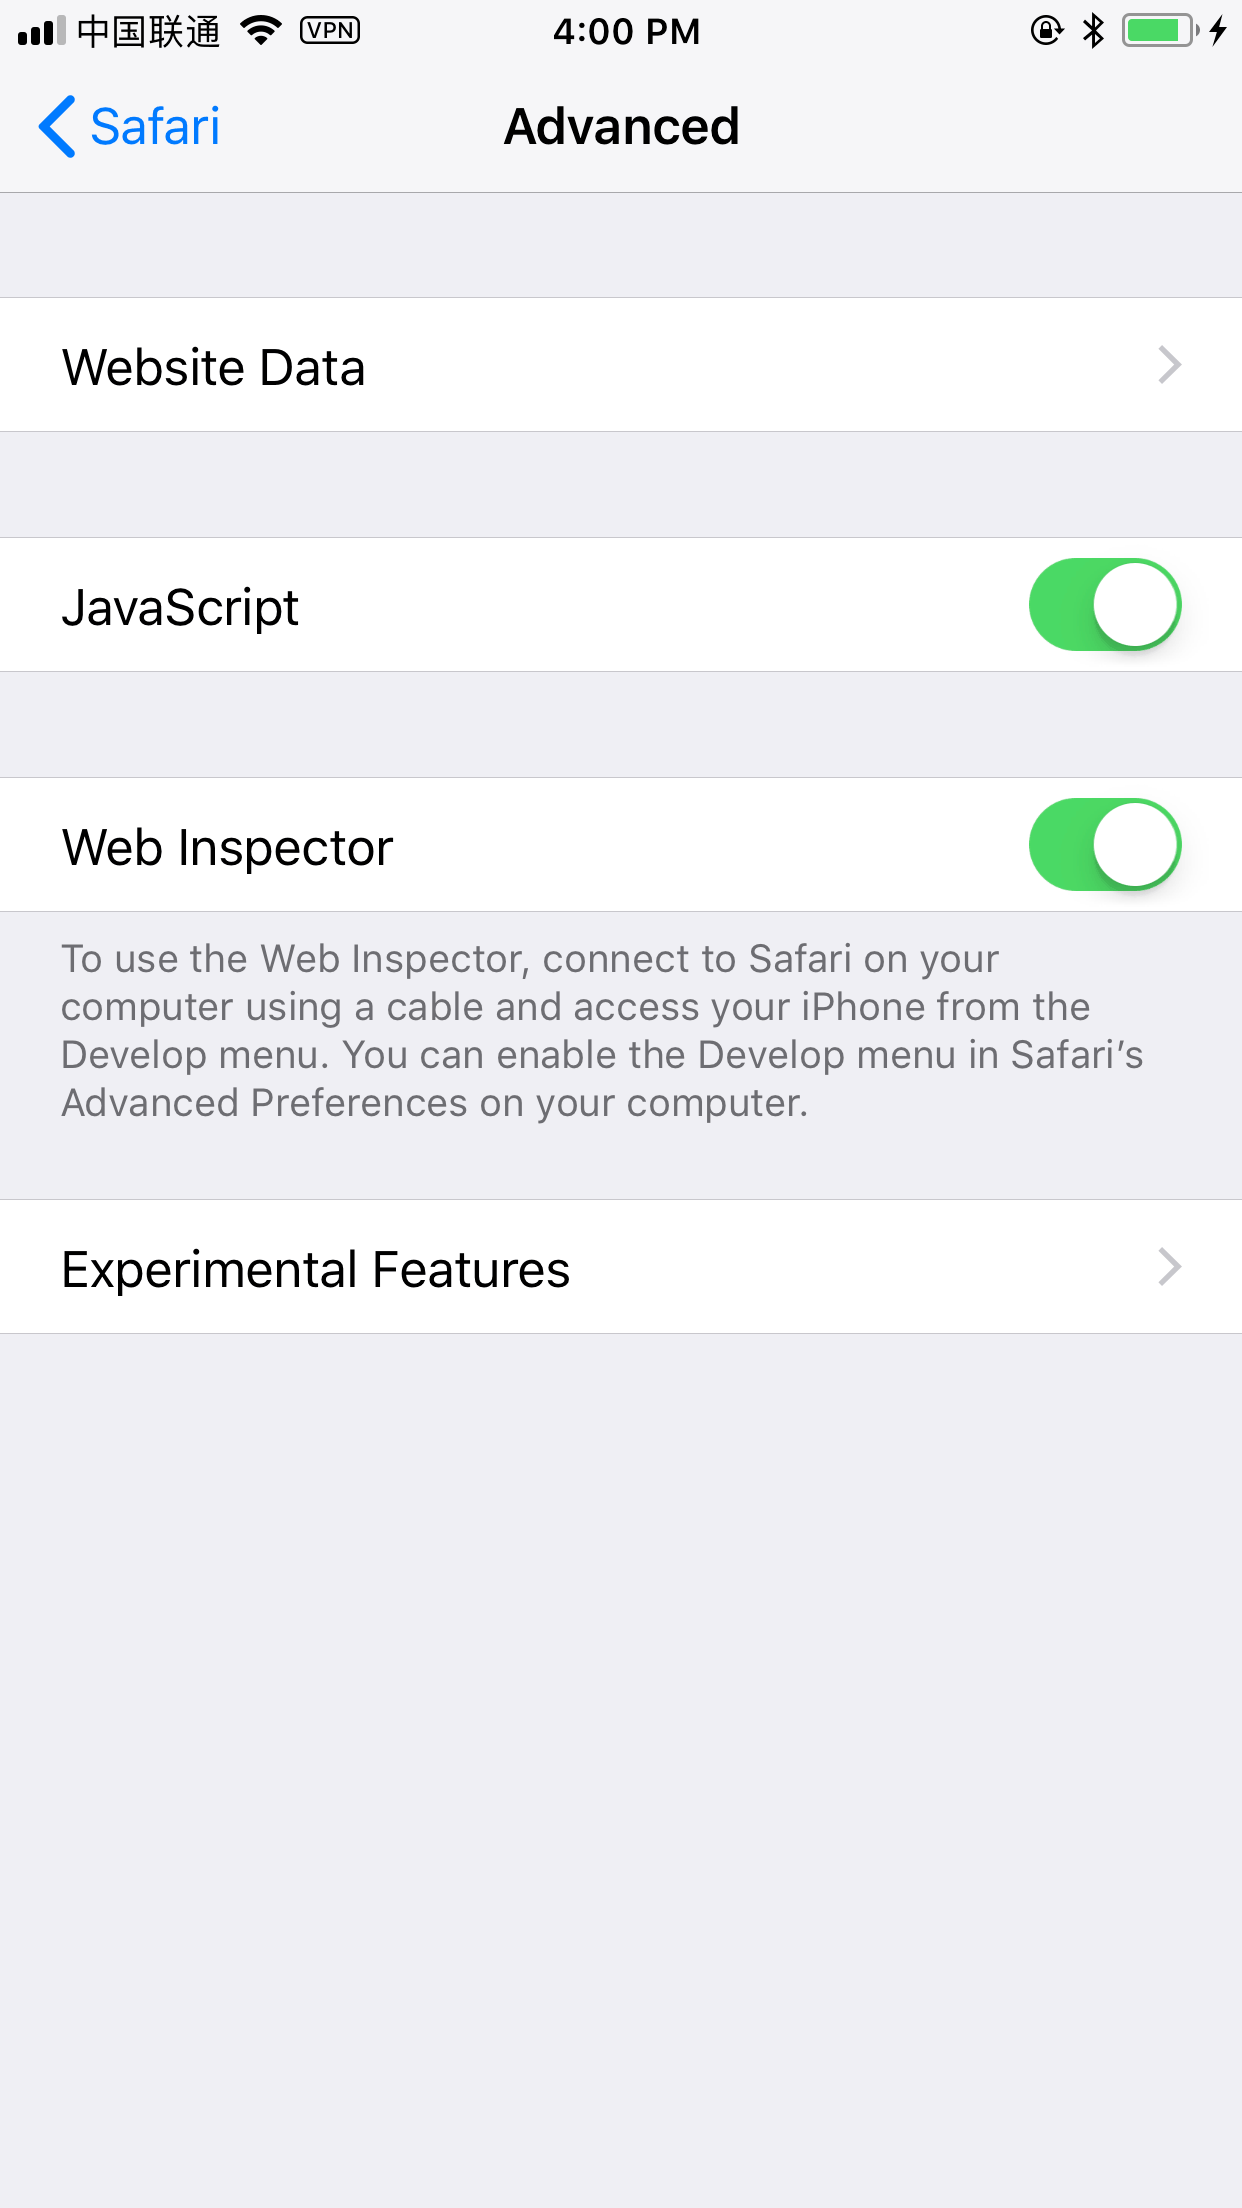
WeChat WebView
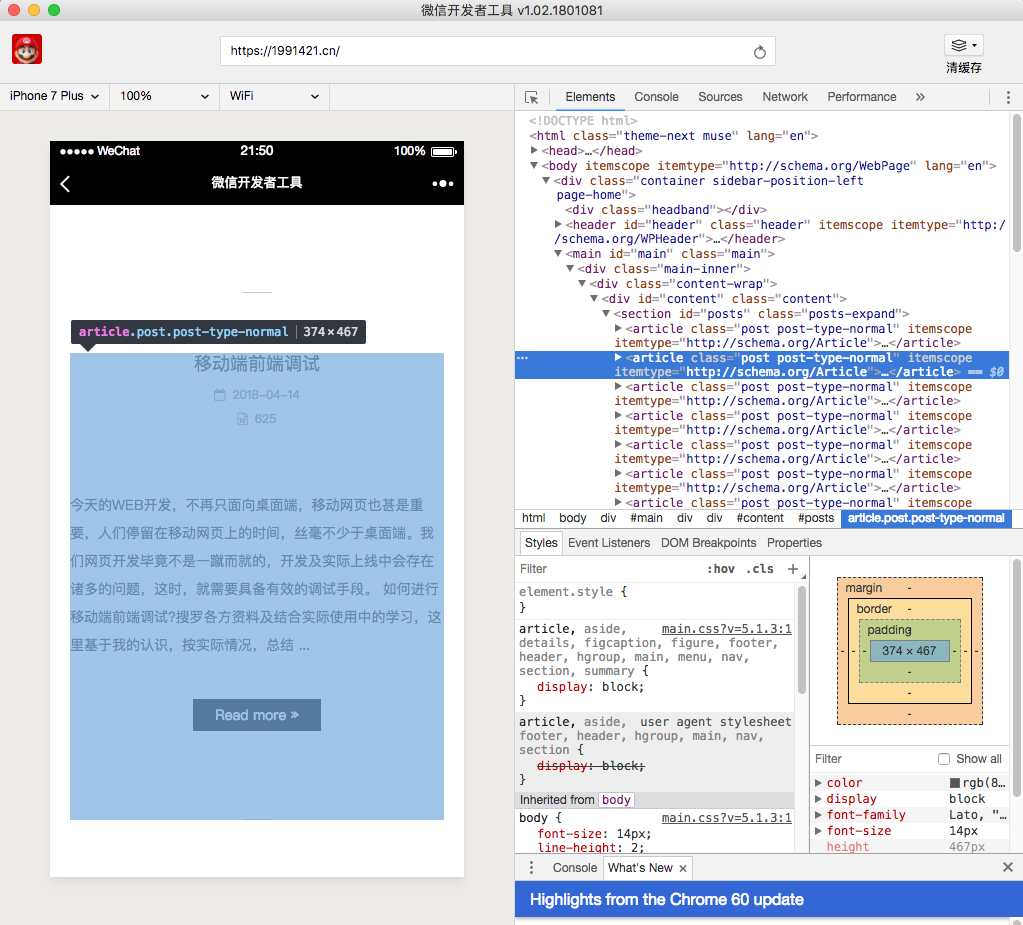
In 2016, WeChat (including the international edition) had 889 million monthly active users. With a user base that large, many mobile pages are WeChat-first, so debugging inside WeChat is critical. Use the official WeChat Developer Tools.

Final Thoughts
On Android, pair the Chrome app with desktop Chrome. On iOS, pair Safari with desktop Safari. Both ecosystems offer mature debugging options. If an iOS user browses with something like QQ Browser, these methods won’t apply—you’ll need alternate tooling (see Reference 1).

