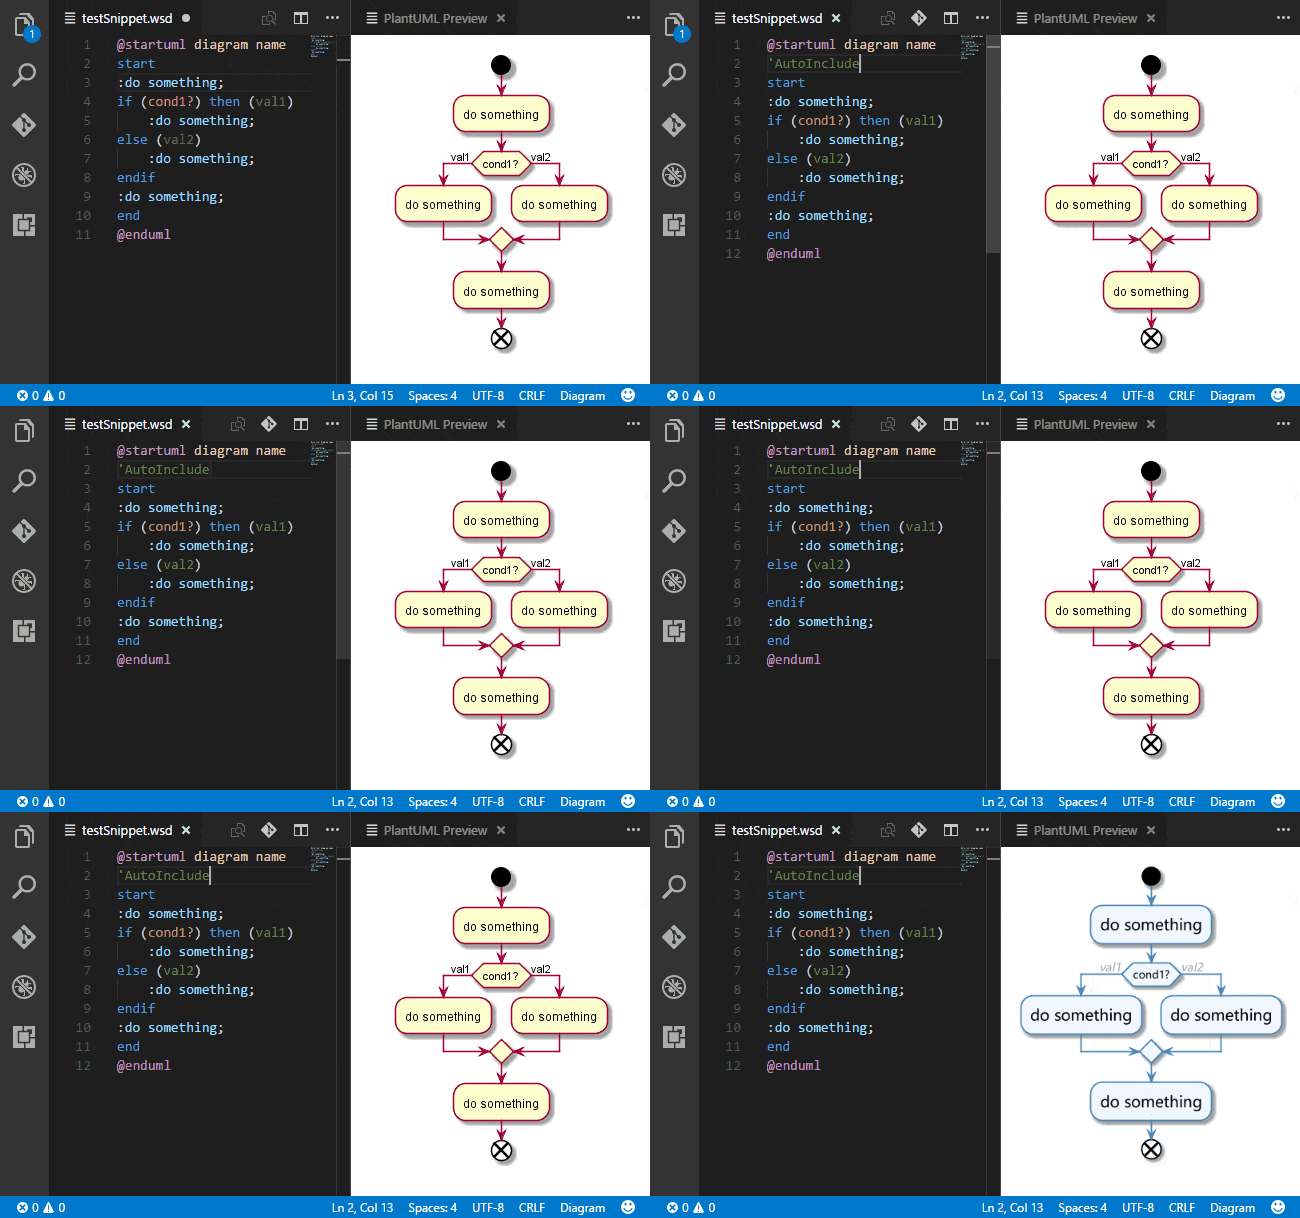
Recently, a colleague recommended a tool called
PlantUML, which uses text to draw complex program logic. After trying it out, I found it quite good, so here’s my learning record.

Plugin Download
Visual Studio Code and JetBrains’ IDEA both have corresponding plugin support. Here are the links.
- Visual Studio Code - PlantUML
- JetBrains - PlantUML integration
Getting Started with Definitions
Now that we have the tools, let’s start learning.
What is UML
Unified Modeling Language (UML) is a non-proprietary third-generation modeling and specification language. UML is an open method for specifying, visualizing, constructing and documenting the artifacts of an object-oriented software-intensive system under development. UML represents a collection of best engineering practices that have proven successful in the modeling of large and complex systems, particularly at the software architecture level.
For complete introduction, click here
PlantUML
PlantUML is an open-source tool that allows you to draw UML diagrams using a text language. PlantUML’s language is a domain-specific language. It uses Graphviz to implement flowchart rendering and layout.
For complete introduction, click here
Diagram Types
Here I’ll just list the diagram categories
- Sequence Diagram
- Use Case Diagram
- Class Diagram
- Activity Diagram
- Component Diagram
- State Diagram
- Object Diagram
- Deployment Diagram
- Timing Diagram
For the usage scenarios of each diagram, I recommend finding more detailed articles.
Common Issues
After understanding common diagrams and syntax, there are still some pitfalls in actual usage. Here are common issues.
File Extensions
Currently supports *.wsd, *.pu, *.puml, *.plantuml, *.iuml
I personally prefer .puml, as it includes uml which makes it clear it's UML
Text Line Breaks
For example, in diagram annotations, text often needs line breaks. How to achieve this? Use \n

Command Line Operations
Sometimes you need to use command line for automated image generation, command as follows:
# Generate UML PNG
java -jar  ./plantuml.jar  -o "./out-png" -progress -tpng -config "./config.txt" ./internal-quote-btn
For jar package download, click here
config.txt is used for custom chart configuration, such as DPI. The default generated charts are not clear, use the following configuration:
skinparam dpi 200
Final Words
I think the beauty of PlantUML is that you can quickly generate images in code form - efficient, beautiful, just like markdown for quick article formatting.
So, mastering it can improve diagram productivity. Let’s go!

