Mastering Chrome tips and tricks can significantly improve development efficiency. Here I’m documenting some techniques I’ve discovered through daily use.
Copying Request Data
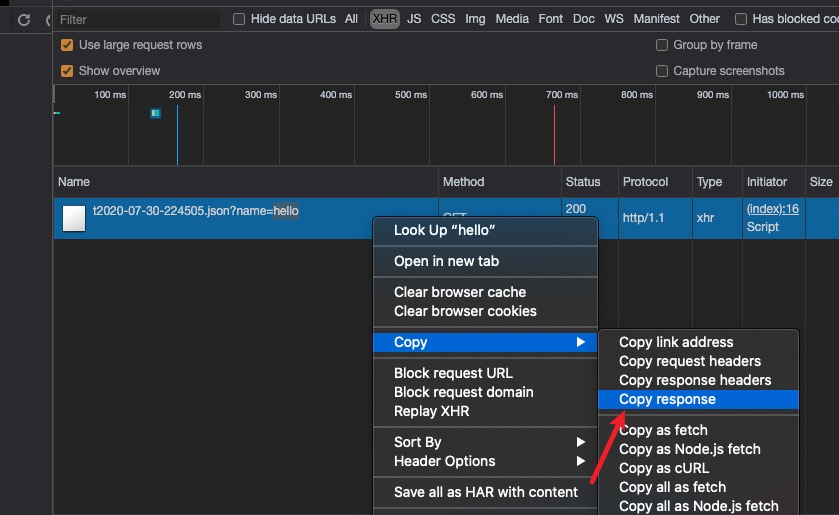
For example, when copying response body content, you might be used to double-clicking to select all in the response tab of request details, but this operation isn’t actually convenient. The fastest way is as follows:

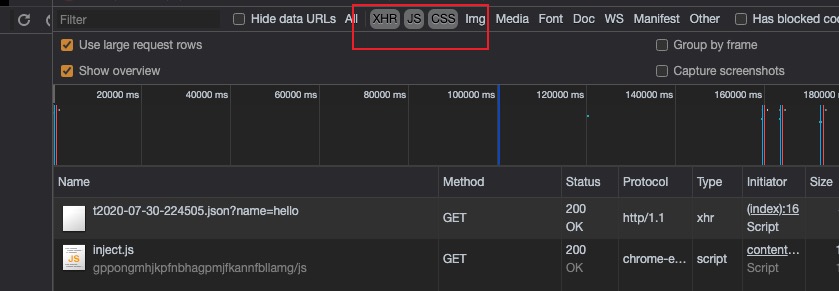
Selecting Multiple Resource Types
Hold down ⌘ (Command key) to select multiple items

designMode
After enabling this in the console, you can directly edit the page. Sometimes it’s quite convenient to make edits and then demonstrate to business stakeholders directly, saving the trouble of taking screenshots and using Photoshop.
document.designMode='on'
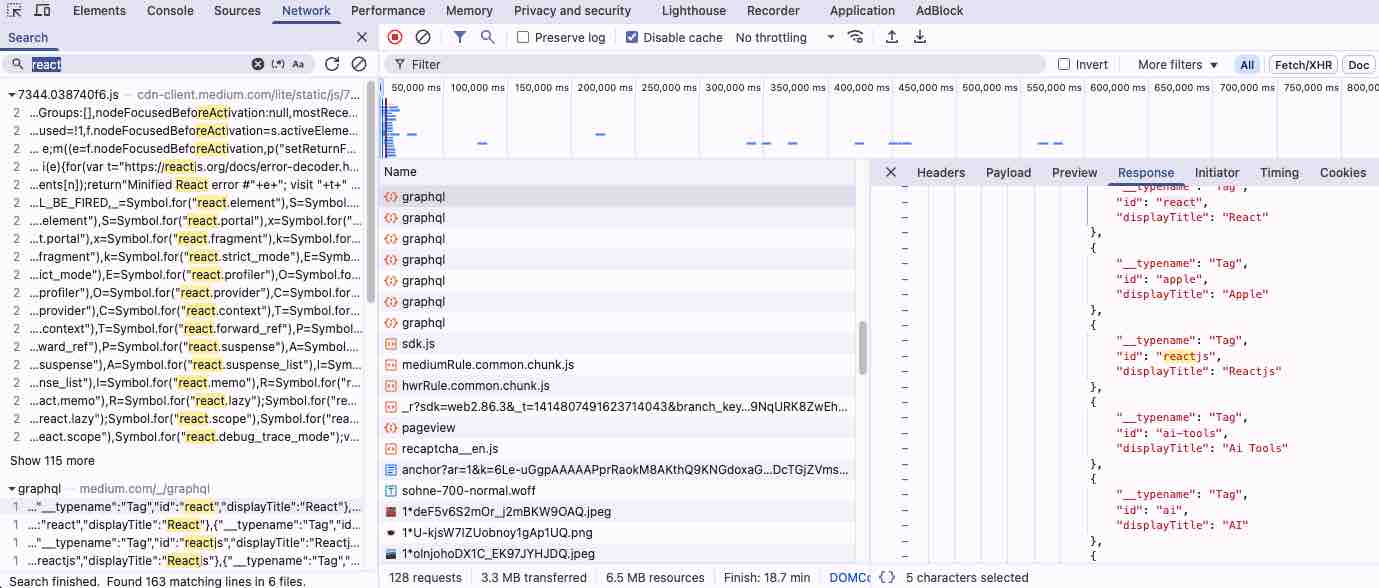
Network Global Search
We often use filters to find target requests, but filters only support URL, status code, and method. Sometimes we only know keywords from the entire request URL or response body, in which case using global search can be more efficient.

Inspecting Hard-to-Capture Elements
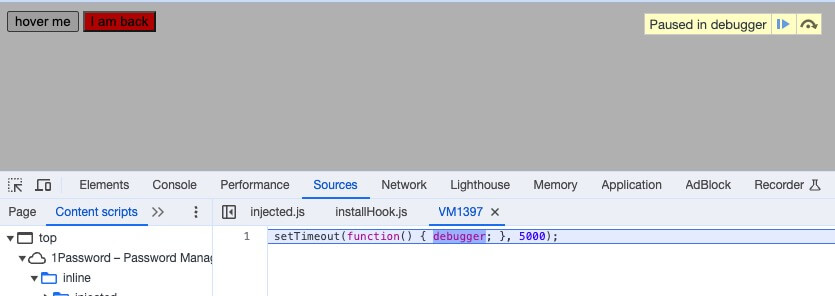
If an element only appears under certain conditions like hover, it’s simple - use DevTools to select the element and force its state to hover. But sometimes conditionally displayed elements are hard to capture - they disappear when you move the mouse over them, which can be frustrating. In this case, you can use the debugger to set a breakpoint.
setTimeout(function() { debugger; }, 5000);
Execute this code in the console to start a timer, operate to display the target element within 5 seconds, then the page will enter breakpoint mode, allowing you to continue using inspect to view the target element and its context state.

Console Utilities
When querying elements in the console, besides using native JavaScript APIs like Document: querySelector(), you can also use Chrome-provided utilities like $(selector).
Commonly used ones are:
- $(selector) - functions as an alias for querySelector
- $$(selector) - functions as an alias for querySelectorAll
Note: $ doesn’t always mean jQuery, unless the page itself has jQuery loaded.
Related Documentation
- https://alan.norbauer.com/articles/browser-debugging-tricks#monitor-focused-element
- https://developer.chrome.com/docs/devtools/console/utilities/#querySelector-function
Final Thoughts
Mastering Chrome DevTools can significantly boost development efficiency and debugging capabilities. These tips and tricks - from copying request data efficiently to using console utilities and debugging hard-to-capture elements - can save valuable time during development. The designMode feature is particularly useful for quick page edits and demonstrations, while the global search in Network tab helps find specific content across all requests. Remember that Chrome DevTools is constantly evolving, so staying updated with new features and techniques is essential for modern web development.

