After project deployment, whenever system interaction issues occur, QA and BA teams often need to consult developers. Developers first check the code, search for log keywords, then perform searches in Kibana. Due to the large volume of log records, various filtering operations are also required. Ultimately, solving the problem might only take 10 minutes, but identifying the target logs can take over 30 minutes. When issues recur, the same time-consuming process repeats.
Looking calmly at this troubleshooting process when problems occur reveals that multiple steps can be standardized and automated, indicating there’s room for optimization.
Log System Technology Stack
Before optimization, let’s understand the current technology stack for logging in our project

- logback
Recording - logstash
Collection - kibana
Viewing
Principles for Log Recording
The Alibaba Java Development Manual (Taishan Edition) is quite good and recommended reading. Of course, ultimately it should be adapted to local circumstances.
Here are several principles I personally value more:
- Separate business logs from exception logs
- Use English to describe log error messages whenever possible. If error messages cannot be clearly described in English, use Chinese instead to avoid ambiguity.
- If exceptions are not handled, they should be thrown upward
Log Recording in Java
Class name,Method name,Line numberLog keywords
For example, the following log record:
log.info("quoteId: {} response: {}", quoteId, JsonConverter.serializeObject(quoteWithSaleRegDTO));
Log Configuration
Console Configuration
logging:
  pattern:
    console: '%p [%d{yyyy-MM-dd HH:mm:ss,SSS}] %c{3}:[%C{1}:%M:%L] - [%t][%file:%line] - %m%n'
logstash Configuration
logstashEncoder.setIncludeCallerData(true)
Detailed configuration click here
Notes
- Log metadata in Kibana depends on logstash configuration, while logback configuration only handles console log printing - they are different
- Logs are also part of the code, similar to comments. As volume increases, maintenance costs also increase. So items like method names and line numbers are strongly correlated but also variable, so automate whenever possible and avoid manual writing.
Log Viewing in Kibana
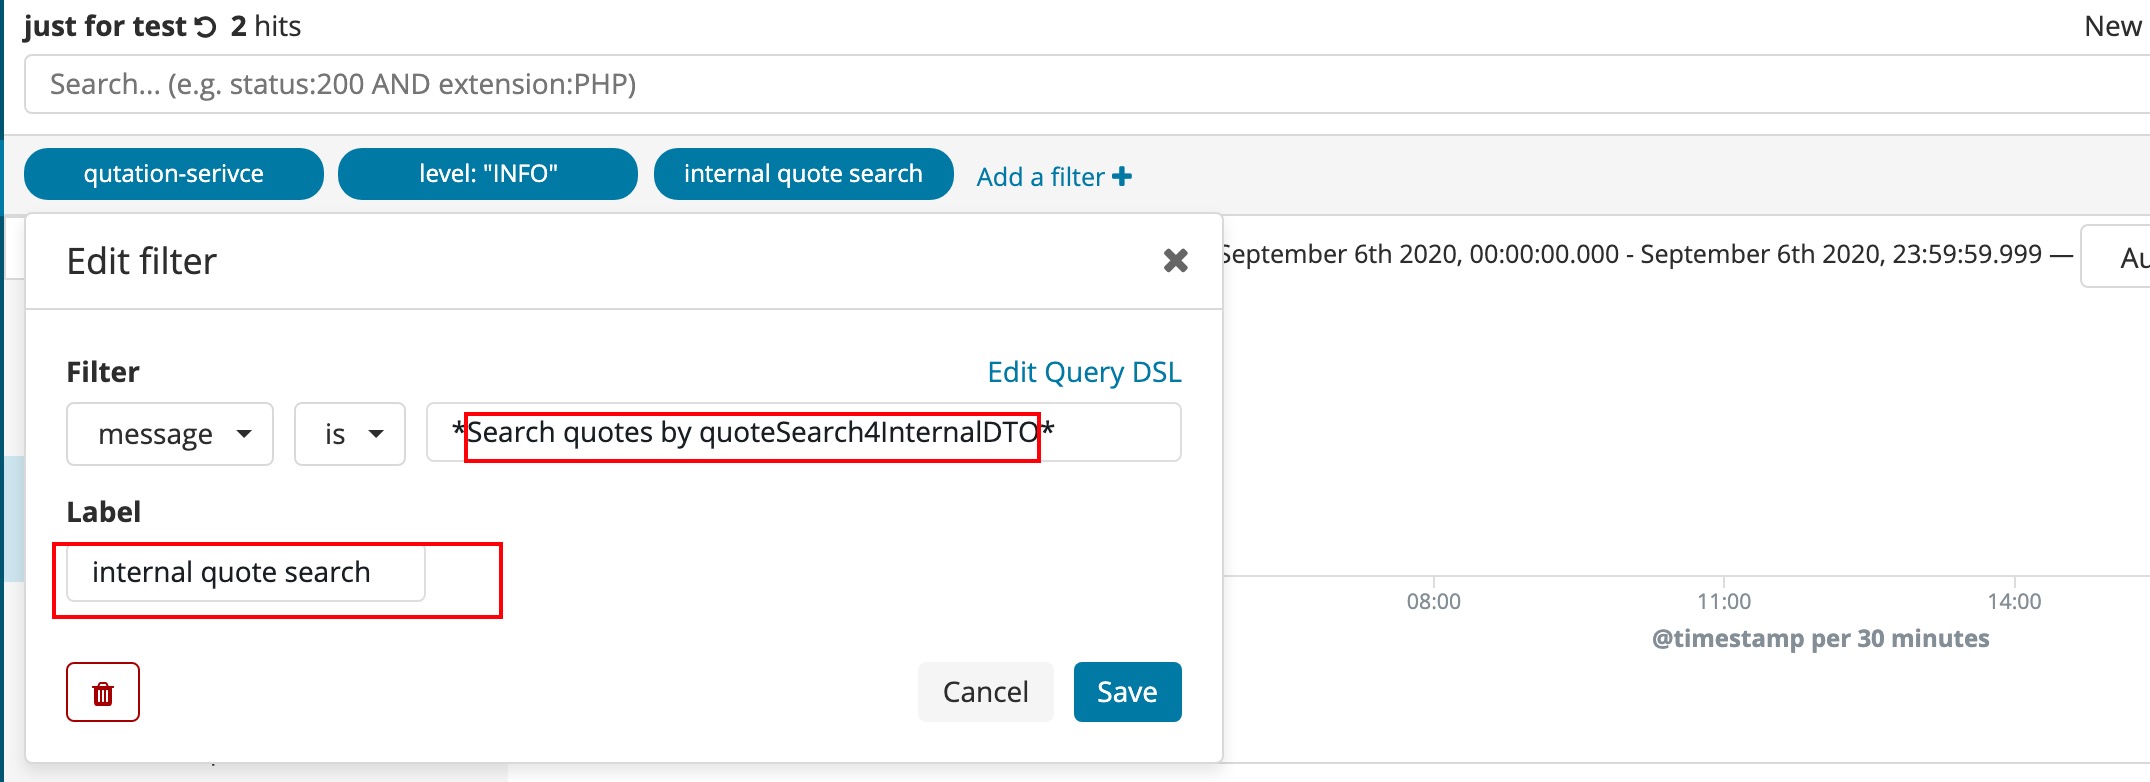
Reconfiguring queries for specific business functions each time is actually very time-consuming. Kibana provides a save function, so a better approach is to store frequently used search conditions, while using labels to describe the conditions.
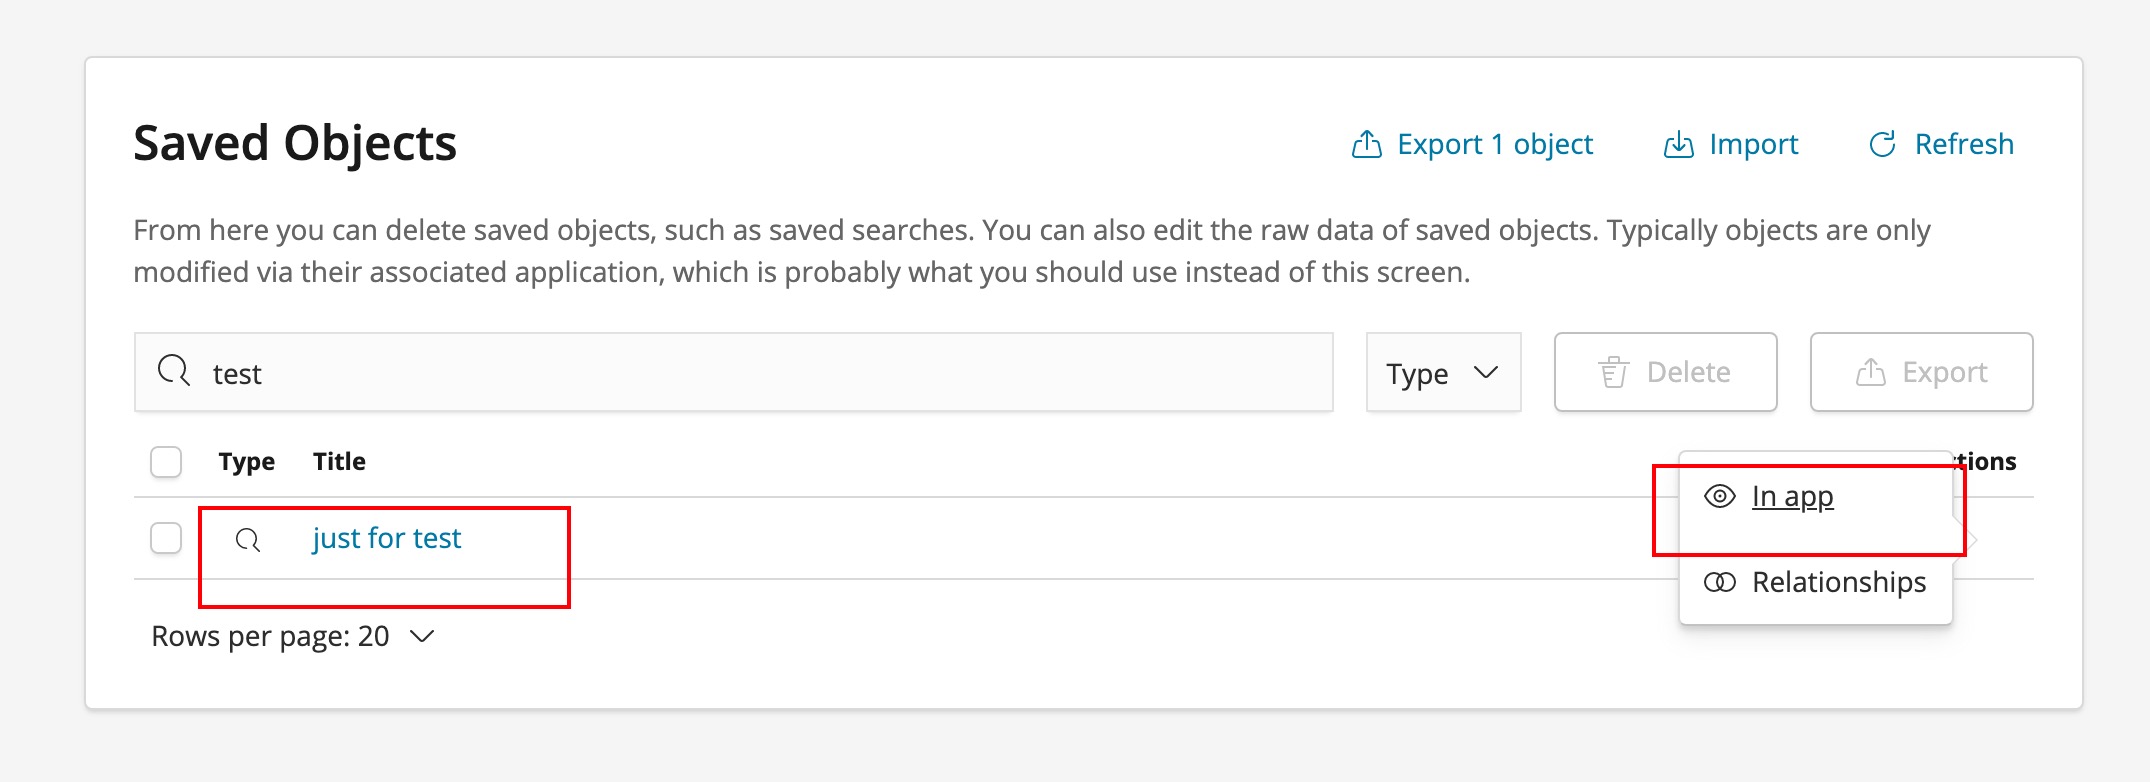
Notes
- Use labels to describe conditions for easier understanding
- Log time ranges and auto-refresh are also important for quickly accessing logs from the problem occurrence period
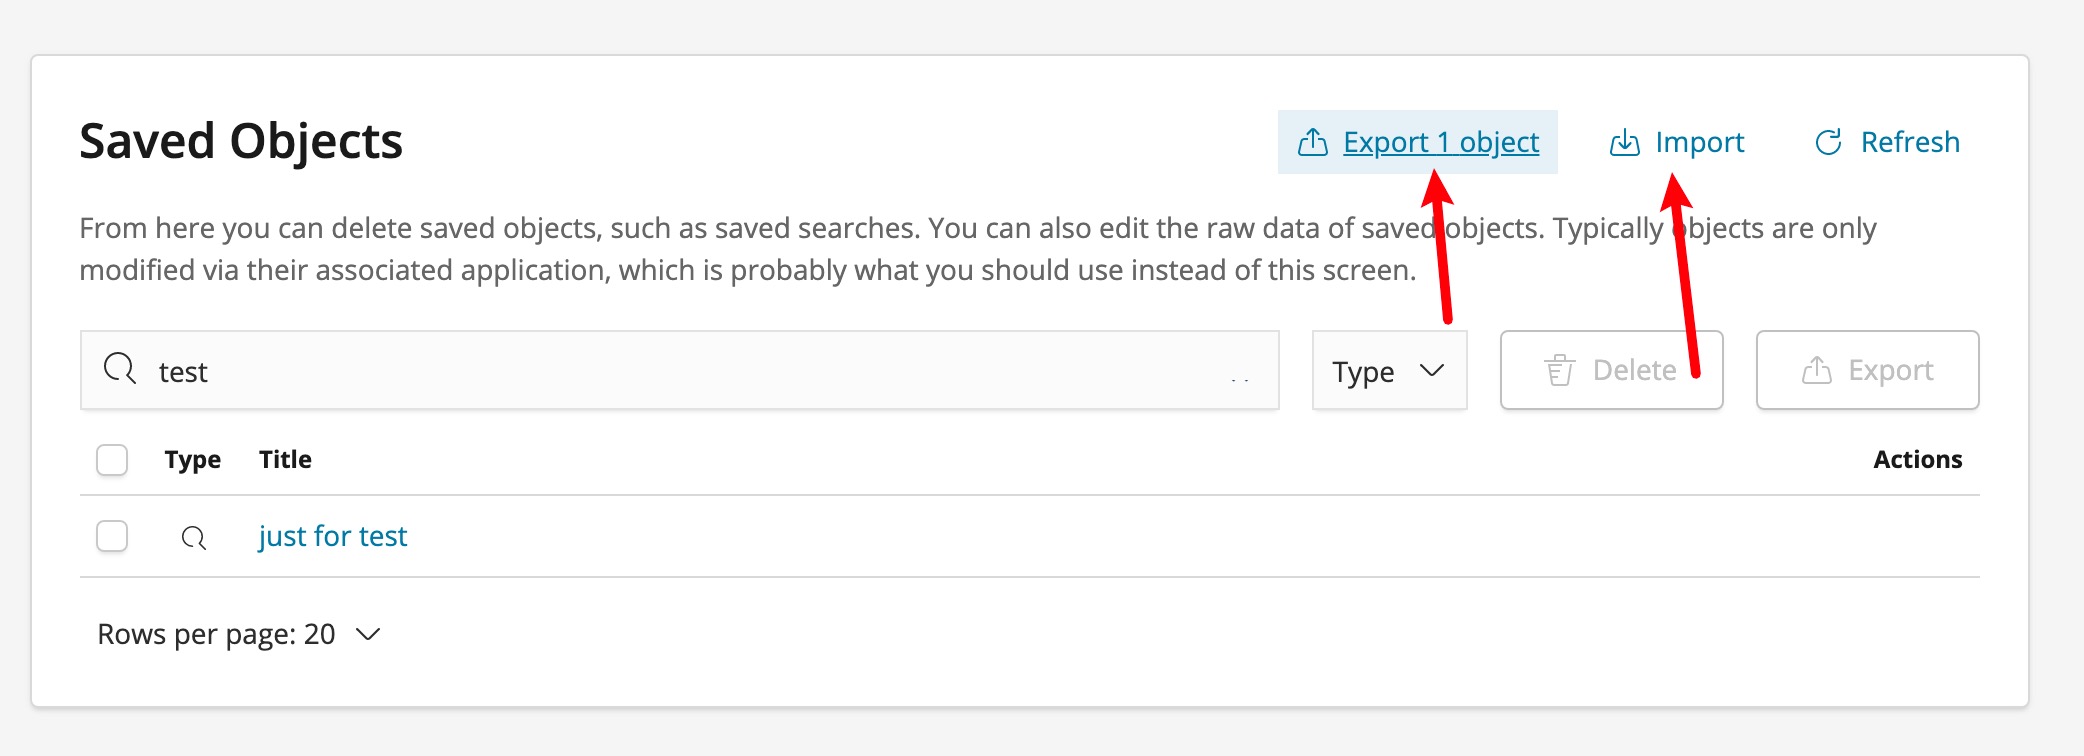
- For different environments where we need quick synchronization and sharing of search configurations, import/export can solve this, avoiding the need to reconfigure each environment system
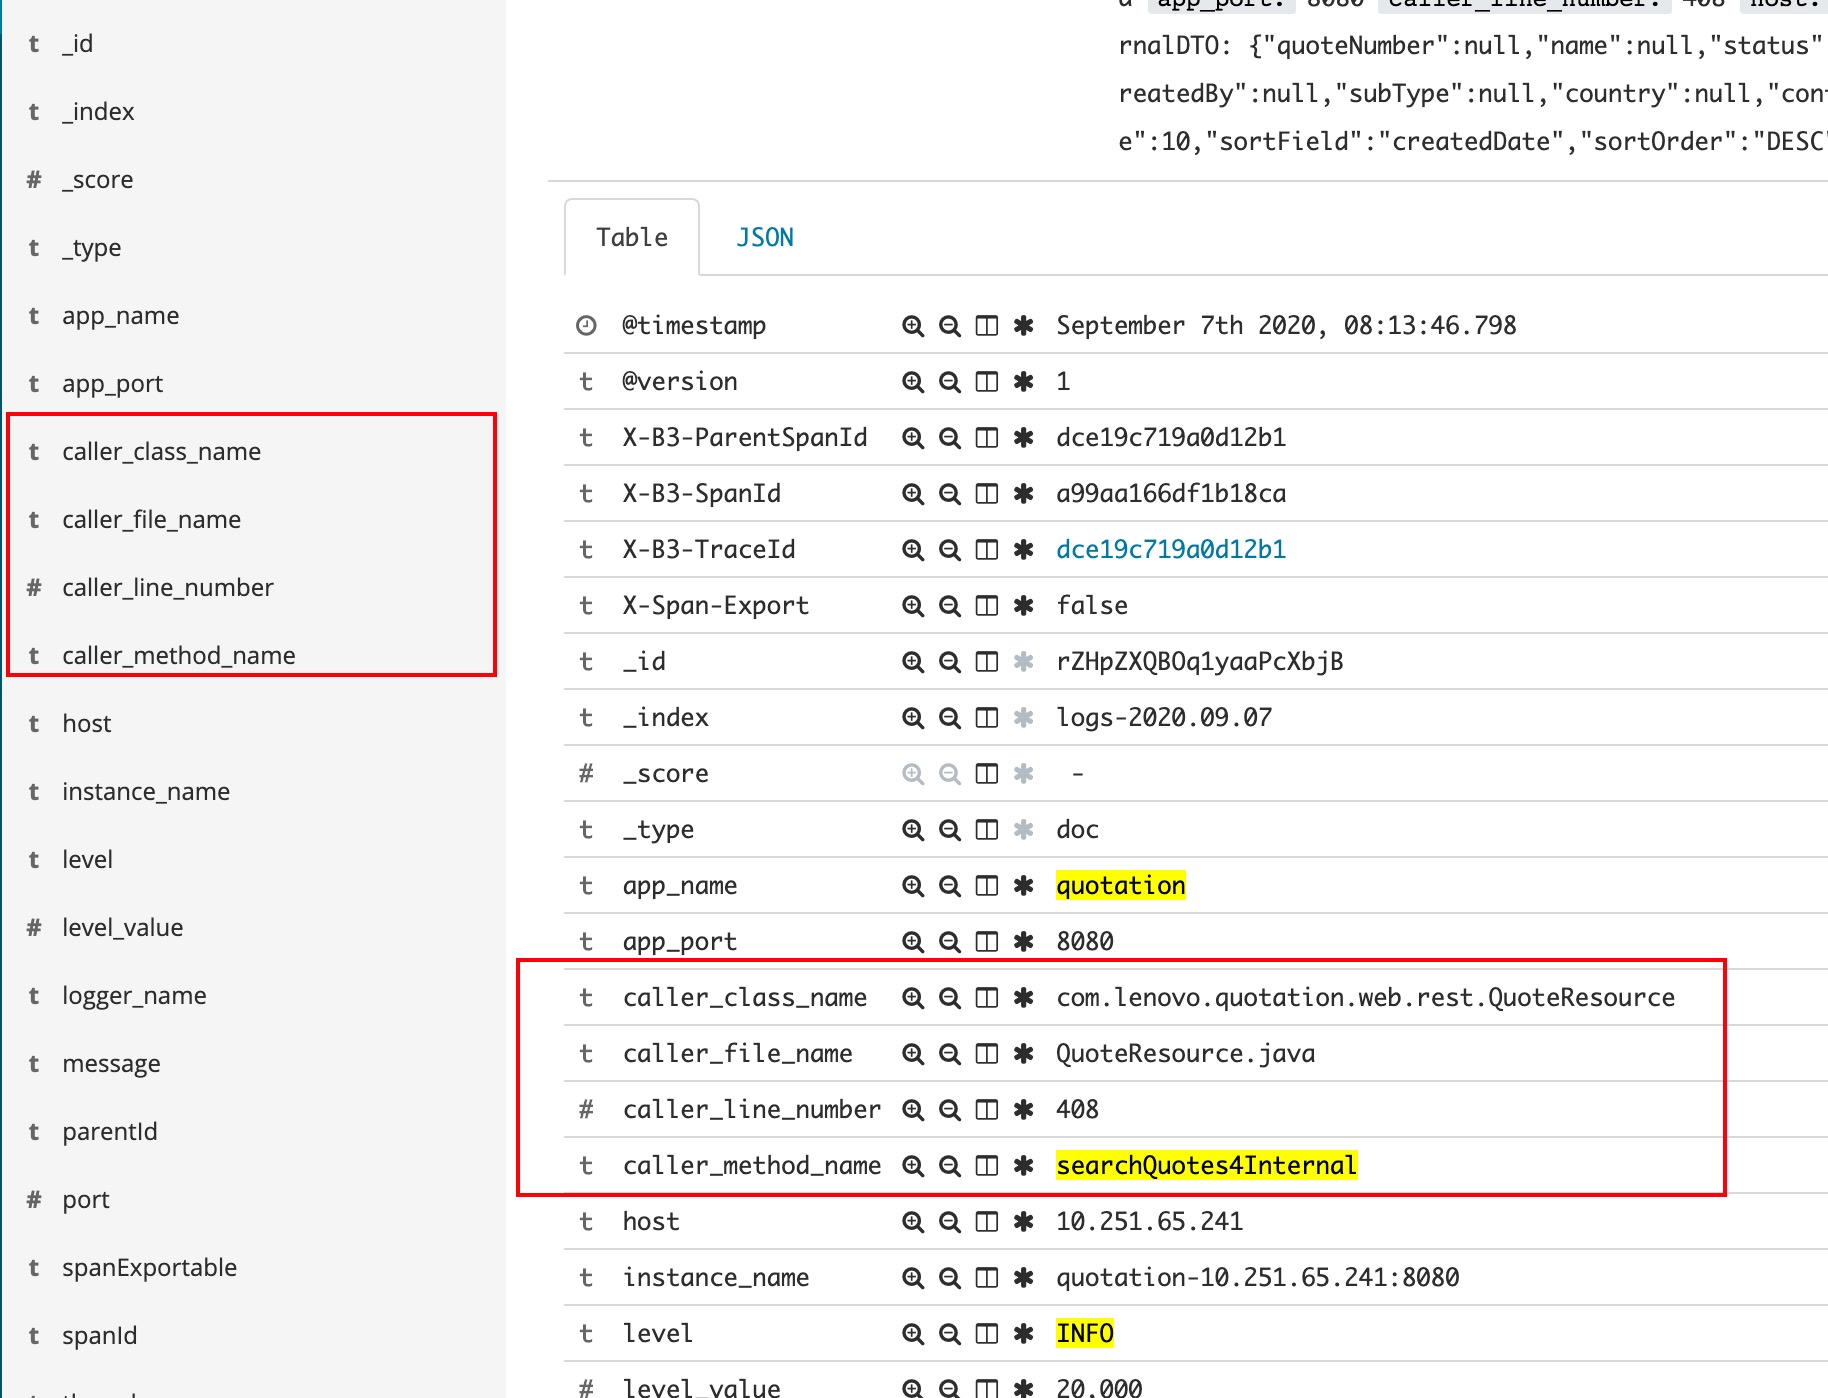
- Fields exposed by callerData like method and class can also be used for search filtering, but for new fields added to Kibana, you need to execute management => index patterns => Refresh field list first before they can be used for filtering
Final Thoughts
- Logs play a crucial role in troubleshooting and tracing various issues after a product goes live. Therefore, valuing logs involves one approach of structuring log information, such as the class names, method names, line numbers, and subjectively injected keyword variables mentioned above. Another approach is optimizing search efficiency using tools for log retrieval.
- Seeing some colleagues blindly writing logs, similar to how they approach comments, it’s important to know that both comments and logs are part of the code. Once written, they incur maintenance costs, so they should be moderate, appropriate, and scientific.