For web debugging, Chrome DevTools Network is often enough. For HTTPS MITM or iPhone captures on macOS, I use Surge. But if you want raw HTTP request/response bytes and to inspect layers beneath the application layer, Wireshark is the right tool.
I recently analyzed a download issue and found Wireshark powerful. Online docs are scattered, so here’s a consolidated summary.
What is Wireshark?
A network protocol analyzer.
As noted, Chrome shows application layer protocols (HTTP, WebSocket), while Surge focuses on HTTP. For a full-stack view of protocols across layers, Wireshark shines.
Common Issues
Installation
Select “Add Wireshark to the system path.pkg” so you can launch it from the command line.
The capture session could not be initiated on interface ’en0’ (You don’t have permission to capture on that device).
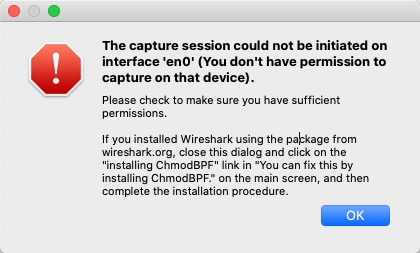
Fix:
sudo chmod 777 /dev/bpf*
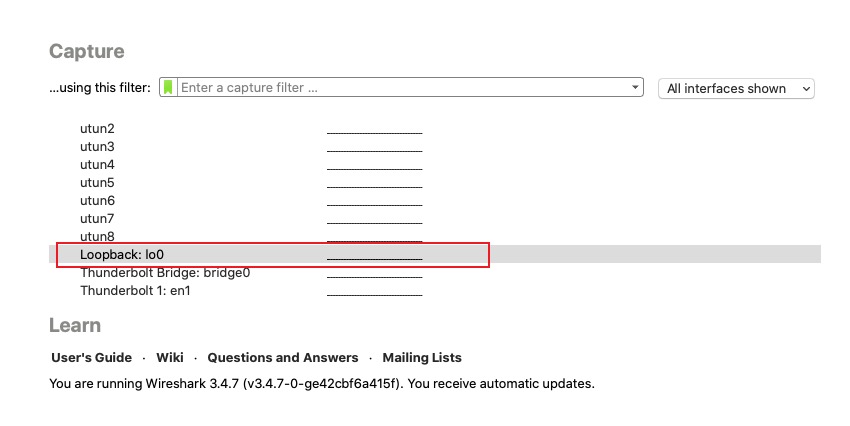
Capture localhost
To capture local traffic, double‑click loopback on the start screen to begin capturing.
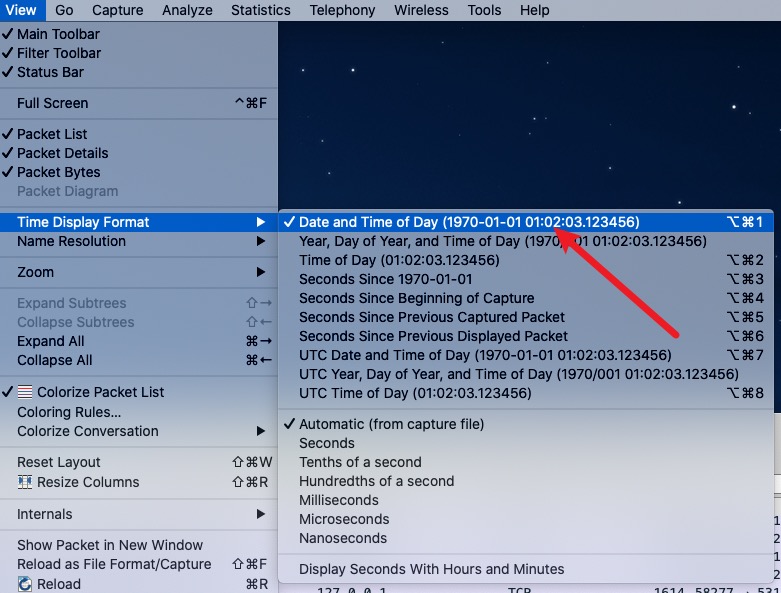
Show local time
By default, timestamps are “since capture started”. To show local time:
Analysis Tips
- Highlight frames, then filter marked frames only:
frame.marked == 1 - Filter by source/destination IP:
ip.src = 192.168.12.66 and ip.dst = 192.168.12.66
Syncing Settings
It takes time to tune Wireshark (columns, coloring rules, plugins). To sync across devices and avoid losing configs, store them in iCloud (or similar) and symlink to Wireshark’s config directory.
ln -s /Users/alanhe/Library/Mobile\ Documents/com~apple~CloudDocs/conf/wireshark /Users/alanhe/.config/wireshark
Final Thoughts
I agree with this Zhihu answer: in frontend work you may not often need Wireshark, but using it to understand the OSI model and full-stack protocols is a superpower.
Learning in progress.