Phenomenon
After entering the page, there is a noticeable delay in web interaction responses for a period of time. For example, when moving the cursor over links, the hand icon doesn’t appear, and clicking is impossible. After some time, when the page data is fully displayed, responsiveness returns.
This problem needs to be solved.
First, let’s outline the current operations after the WEB page loads:
- Request backend data
- Decode data using
base64 - Render table to display data
Analysis
The following shows the interface request data:
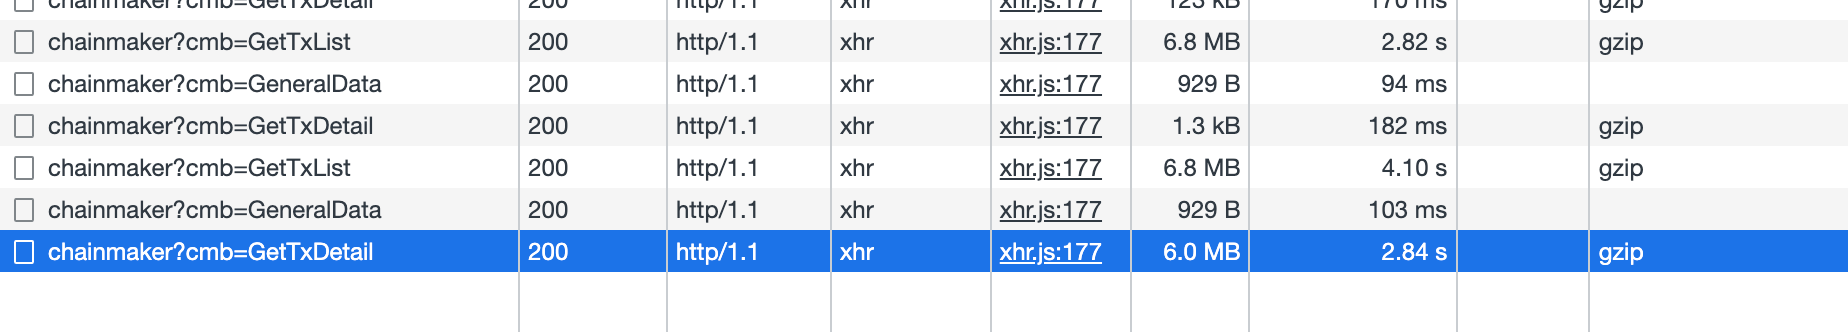
The data is indeed quite large - requesting this data took 2+ seconds, but the stuttering feeling clearly exceeded this time, and even when the data was returned, the page was still unresponsive.
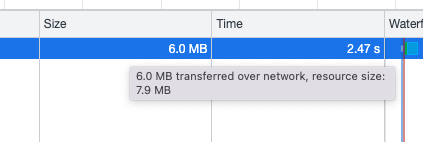
Then base64 decoding was performed on the data. Using console.time timer testing revealed the time spent as follows. Also, this portion of data after base64 decoding increased in size from 7.9MB to 14MB.
However, based on the decoding completion time and webpage effects, after decoding completed, the webpage didn’t quickly render the data - it took some additional time. Therefore, it can be roughly determined that the direct cause was the 14MB text display causing page stuttering.
To prove this point, the data was truncated after decoding, for example using substring(0, 256), and testing found it was indeed much faster. Therefore, this is indeed the crux of the problem.
Solution
- Product-level adjustments: If this type of data doesn’t necessarily need to be displayed completely, it can be truncated for display. For cases where complete data acquisition is desired, consider file download as an alternative form.
Although the above problem has been solved, if performance issues are encountered later, how can we quickly diagnose which direction the problem is coming from? So we need to consider performance analysis methods.
Chrome Developer Tools - Performance Analysis
Chrome Developer Tools provides developers with two commonly used tools to analyze webpage performance - Performance/Lighthouse
Under Performance, you can see performance overhead for loading/specific time period recordings
Lighthouse provides overall performance evaluation scoring for site loading and gives optimization suggestions.
However, after using Performance to record and analyze the problematic webpage, it was found that during the stuttering period after base64 decoding, nothing could be seen happening on the main thread. Only then did I understand that Performance has blind spots for performance analysis.
tracing
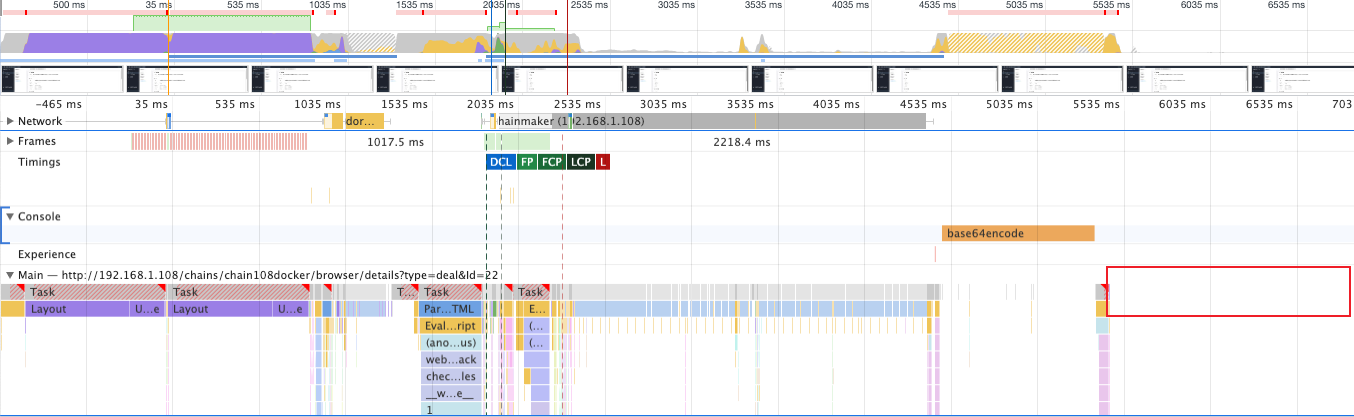
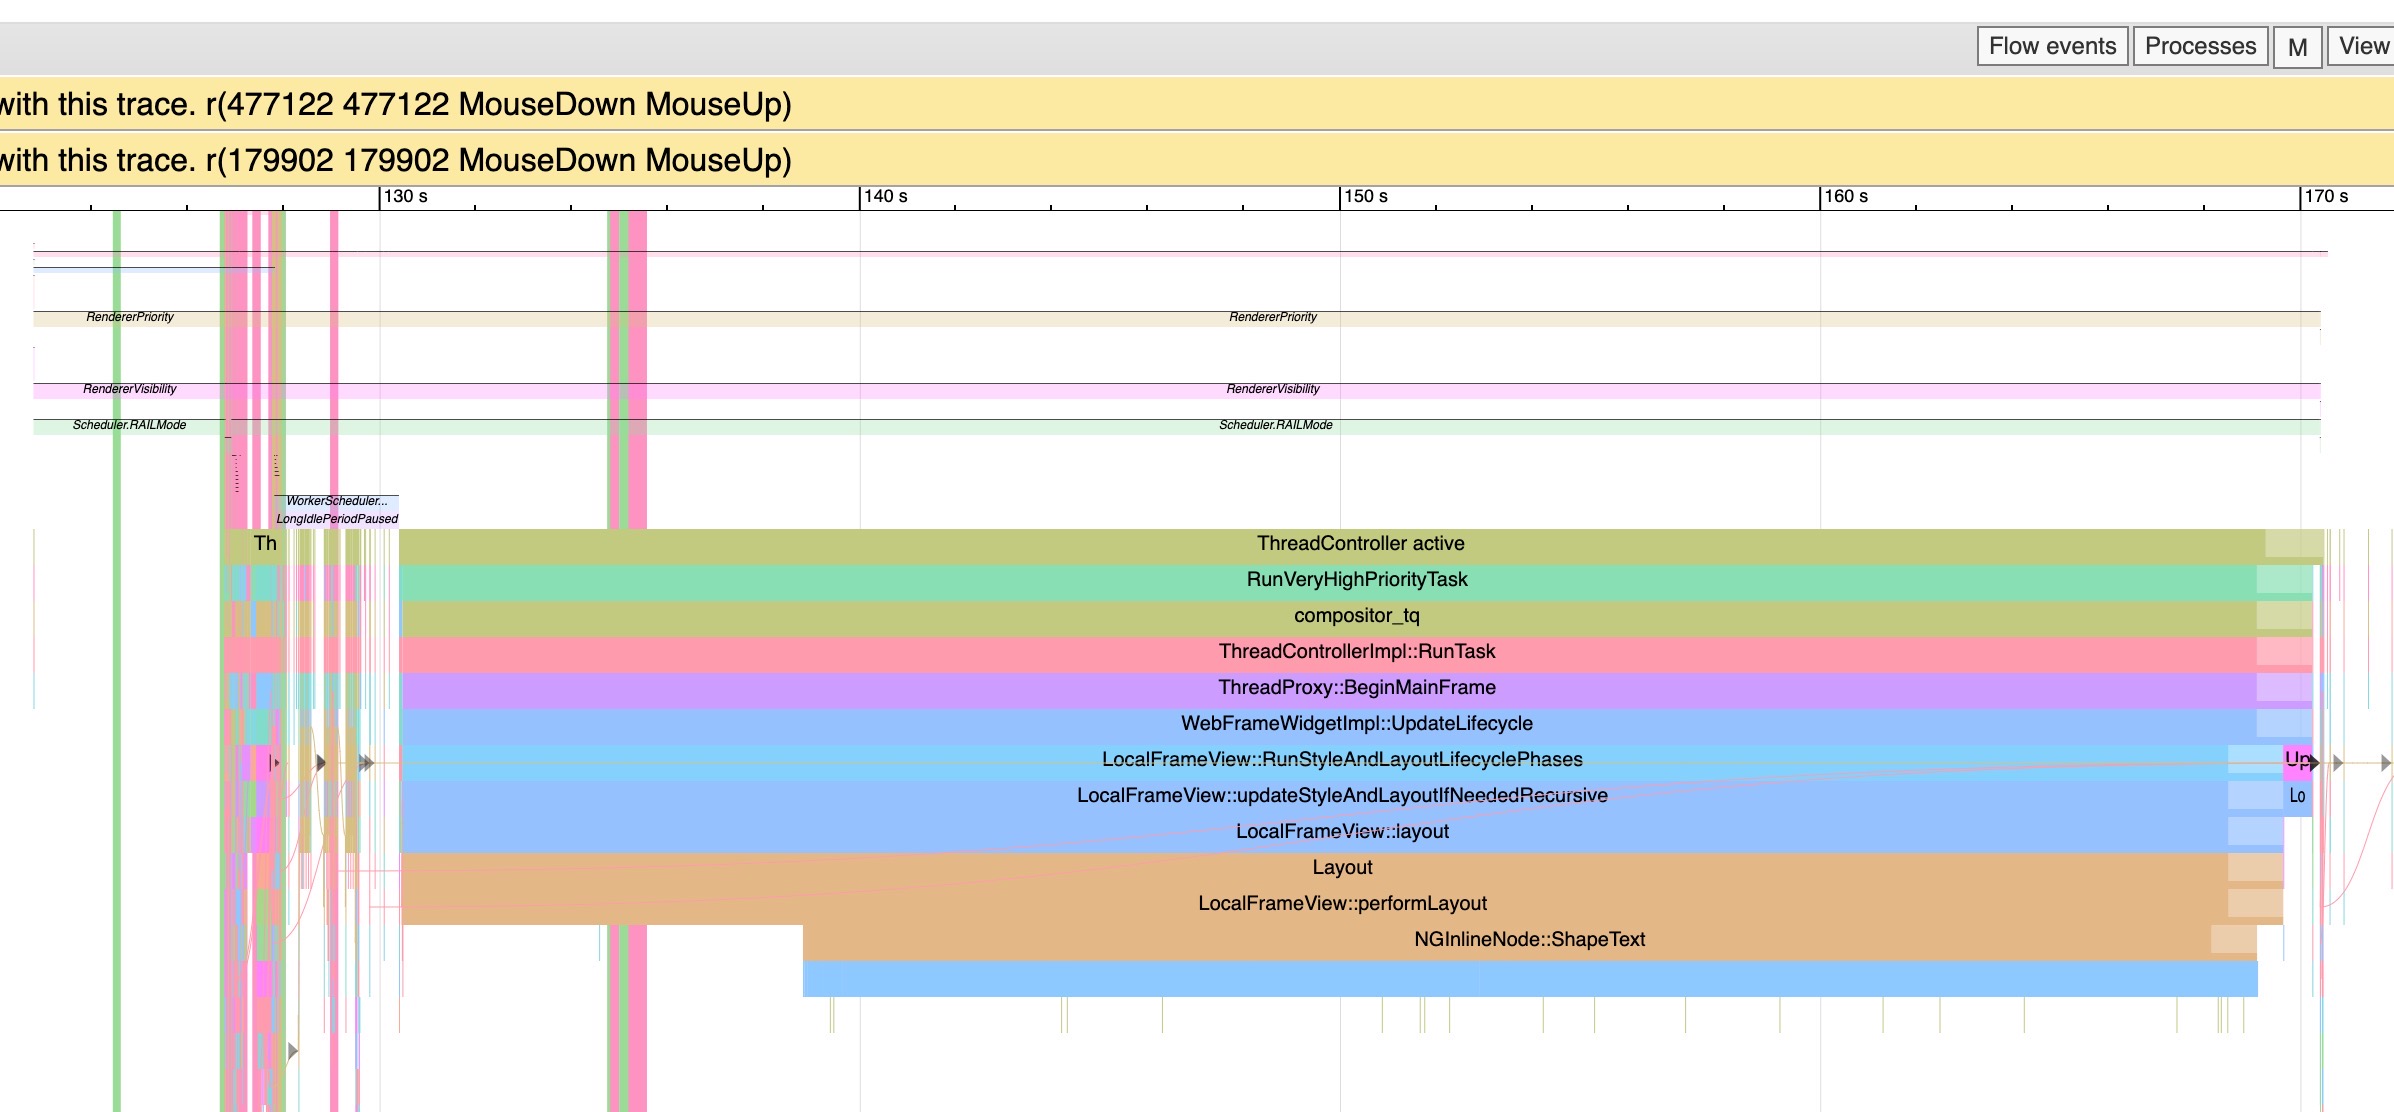
A colleague’s suggestion helped me find a solution. In Chrome, besides the above two tools, there’s another performance analysis tool called tracing. Using this tool to re-record, I finally found the time period of rendering stuttering, and what was happening during that time was layout.
As shown in the brown Layout section in the image below, this is the stuttering time period.
Usage Instructions
- Enter
chrome://tracing/in the address bar - When recording, if unsure about category selection, click
Edit Categories, select all types. To view the target webpage, select as needed under Processes based on the site link title.
Final Thoughts
Through this problem, I gained the following insights:
- High-time-consuming JS operations can use worker/background computation methods
- Flexibly use these three tools in Chrome for performance analysis/problem troubleshooting