When using WebStorm/Visual Studio Code, for scripts defined in package.json, we can directly click debug to start the script. Why does this allow debugging? Here’s a coarse-grained explanation.
Debugging in IDE
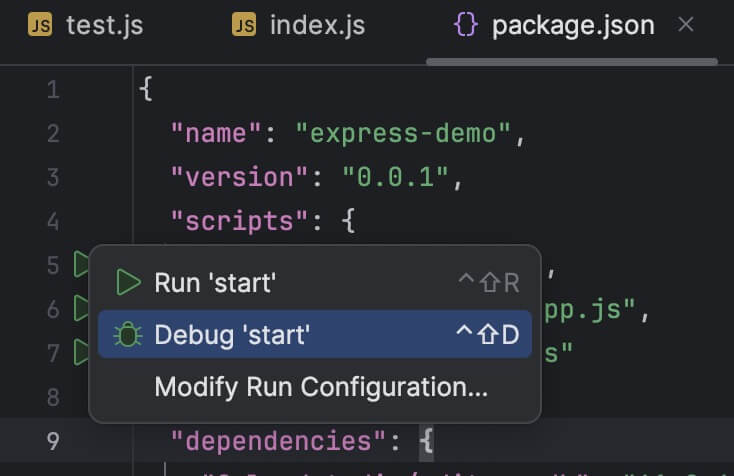
For example, the original script is "start": "node app.js", When we need to debug this Node service, clicking the debug button shows the following print information:
/Users/alanhe/.nvm/versions/node/v18.16.1/bin/npm run start

> express-demo@0.0.1 start
> node app.js

Debugger listening on ws://127.0.0.1:63206/3fc8664c-10d9-4f99-8ed8-04efd382d9ae
For help, see: https://nodejs.org/en/docs/inspector
Debugger attached.
Example app listening on port http://127.0.0.1:8000!
You can see an additional ws request, which is the service debugging connection. This essentially means it’s the inspector under Node.js.
What does the IDE do here? It actually adds the inspect parameter settings.
inspect in Node
The above debug is equivalent to the following command:
node --inspect=127.0.0.1:63206 app.js
Therefore, even without using IDE debug, it’s possible to do this. However, when we directly use this command, it won’t hit IDE breakpoints yet. We still need to configure it in the IDE.
For WebStorm, you need to start Attach to Node.js/Chrome. For VSC, it’s Debug:Attach to Node Process.
After attaching, you can normally debug breakpoints in the IDE.
- Detailed explanation of inspect click here
- The default inspect configuration is
127.0.0.1:9229
Final Thoughts
The reason for being confused about this issue is that when inspect is manually configured in the script, and then debug operation is performed in the IDE, you’ll find that breakpoints can’t be hit. The reason is that with manual inspect, the IDE cannot automatically capture the corresponding process, so it doesn’t work.